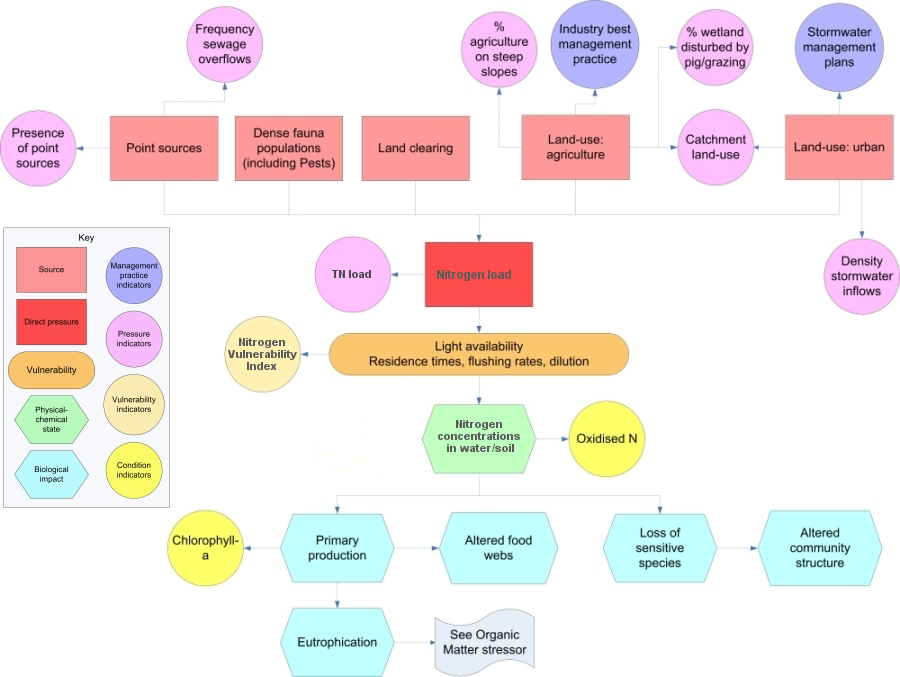
Nitrogen (N) inputs to wetlands must be viewed in the context of the broader region, sub-region and landscape:
Regional and sub-regional drivers: include rainfall (timing, frequency, intensity, periodicity), evapotranspiration, aridity and temperature. These features affect the nature of the wetland, the amount of water and associated N entering the wetland, and the rate of N processing[6].
Size of the wetland: generally, larger wetlands have the potential to process more N.[2]
Location in the landscape: wetlands located lower in the floodplain are more likely to experience higher N loads, and therefore can process more N[2], however these wetlands are also the most vulnerable to the damaging effects of too much N. Wetlands located higher in catchments are likely to be exposed to lower N loads, unless agricultural or urban activities are present in the sub-catchment area the wetland is in.
Land use and vegetation in the catchment: catchments that have a large proportion of their area covered with vegetation and carbon-rich soils, will have reduced water flows and reduced N loads entering the wetlands[9].
Geology and soils of the surrounding catchment: soil type (e.g. composition, grain size etc.) may affect the level of infiltration and runoff of water and N loads prior to reaching the wetlands.
The catchment area of the wetland: the catchment area has a major impact on the wetland's ability to process N. If the area upstream is too large the wetland may still process N, but it's contribution at the catchment scale would be small, and its residence time may be less[6].
The hydrological connection between the wetland and the surrounding area: if the wetland is highly connected to the surrounding catchment, it has the potential for processing more N[7]. Some wetlands are often bypassed by floods, but they might still be connected through groundwater flows.
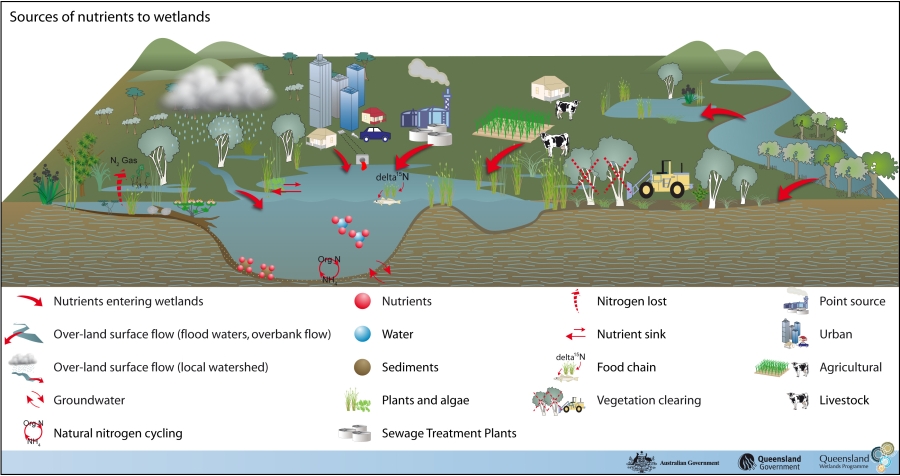
Sources of nitrogen
Water
Surface water - diffuse: Surface water is a large, but sporadic, source of dissolved and particulate nitrogen to palustrine wetlands. During the wet season floodwaters can cover palustrine wetlands for days or weeks at a time[4]. The amount of dissolved and particulate N delivered by surface waters every year into wetlands is dependent on the land use of the catchment. In the Great Barrier Reef (GBR) catchments, values of particulate N (7,100 (4,000-10,000) g/ha/day)[4][3] have been estimated on data from sugarcane landuse during wet periods.
Groundwater - diffuse: Groundwater can contribute a continuous input of N to wetlands, and in more porous catchments, it can be the main source of N[8]. In the GBR catchments, some agricultural landuses, such as sugar cane, input N to the groundwater at a rate of 137 (58-222) g/ha/day[8]. Wetlands with a significant groundwater input (usually lower in the catchment) are likely to receive groundwater N with concentrations associated with the land use of the upper catchment.
Air
Nitrogen gas in the atmosphere can be deposited in wetlands by either fixation or deposition.
The concentration of N gases in the atmosphere is about 78%[5]. It can be higher than this background level in industrial areas due to anthropogenic emissions.
Biota
N inputs by animals is in general relatively small (2.9 (1.9-3.8) g/ha/day)[1]. However, some animal inputs, such as from birds and pigs, could have a significant input at a regional scale (e.g. tree or shallow ponds).
Plants and algae can act as nutrient sinks as they remove nutrients from the water column/groundwater.
Anthropogenic (direct human impacts)
Fertiliser, only if part of a farm, used during dry years.
Nitrogen from Sewage Treatment Plants (STP) or approved/licenced activities have an increased delta15 N signature which can be traced through the food chain.
^ Hahn, S, Bauer, S & Klaassen, M (2008), 'Quantification of allochthonous nutrient input into freshwater bodies by herbivorous waterbirds', Freshwater Biology, vol. 53, pp. 181-193.
^ab Hansen, AT, Dolph, CL, Foufoula-Georgiou, E & Finlay, JC (2018), 'Contribution of wetlands to nitrate removal at the watershed scale', Nature Geoscience. [online], vol. 11, no. 2, pp. 127-132. Available at: http://dx.doi.org/10.1038/s41561-017-0056-6.
^ Joo, M, Raymond, MAA, McNeil, VH, Huggins, R, Turner, RDR & Choy, S (2012), 'Estimates of sediment and nutrient loads in 10 major catchments draining to the Great Barrier Reef during 2006-2009', Marine pollution bulletin. [online], vol. 65, no. 4-9, pp. 150-166. Available at: Scopus.
^ab Karim, F, Kinsey-henderson, A, Wallace, J, Arthington, AH & Pearson, RG (2012), Modelling wetland connectivity during overbank flooding in a tropical floodplain in north Queensland, Australia, vol. 2723, pp. 2710-2723.
^ Kotz, JC, Treichel, P, Townsend, JR & Treichel, DA (2019), Chemistry & chemical reactivity, p. 1187, Cengage Learning, Boston, MA.
^ab Piña-Ochoa, E & Álvarez-Cobelas, M (2006), 'Denitrification in aquatic environments: A cross-system analysis', Biogeochemistry, vol. 81, no. 1, pp. 111-130.
^ Racchetti E., Bartoli M., Soana E., Longhi D., Christian R.R., Pinardi M. (2011), 'Influence of hydrological connectivity of riverine wetlands on nitrogen removal via denitrification.', Biogeochemistry. [online], no. 103, pp. 335-354. Available at: https://doi.org/10.1007/s10533-010-9477-7.
^ab Rasiah, V, Armour, JD, Yamamoto, T, Mahendrarajah, S & Heiner, DH (2003), 'Nitrate dynamics in shallow groundwater and the potential for transport to off-site water bodies', Water Air and Soil Pollution, vol. 147, pp. 183-202.
^ Seitzinger, S, Harrison, JA, Bohlke, JK, Bouwman, AF, Lowrance, R, Peterson, B, Tobias, C & Vand, D (2006), 'Denitrification across landscapes and waterscapes: A synthesis', Ecological Applications, vol. 16, no. 6, pp. 2064-2090.
Last updated: 28 July 2021
This page should be cited as:
Department of Environment, Science and Innovation, Queensland (2021) Nitrogen – Pressures, WetlandInfo website, accessed 18 March 2024. Available at: https://wetlandinfo.des.qld.gov.au/wetlands/management/pressures/nitrogen/pressure.html


 — Department of Environment, Science and Innovation