|
|
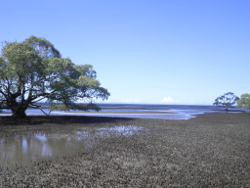
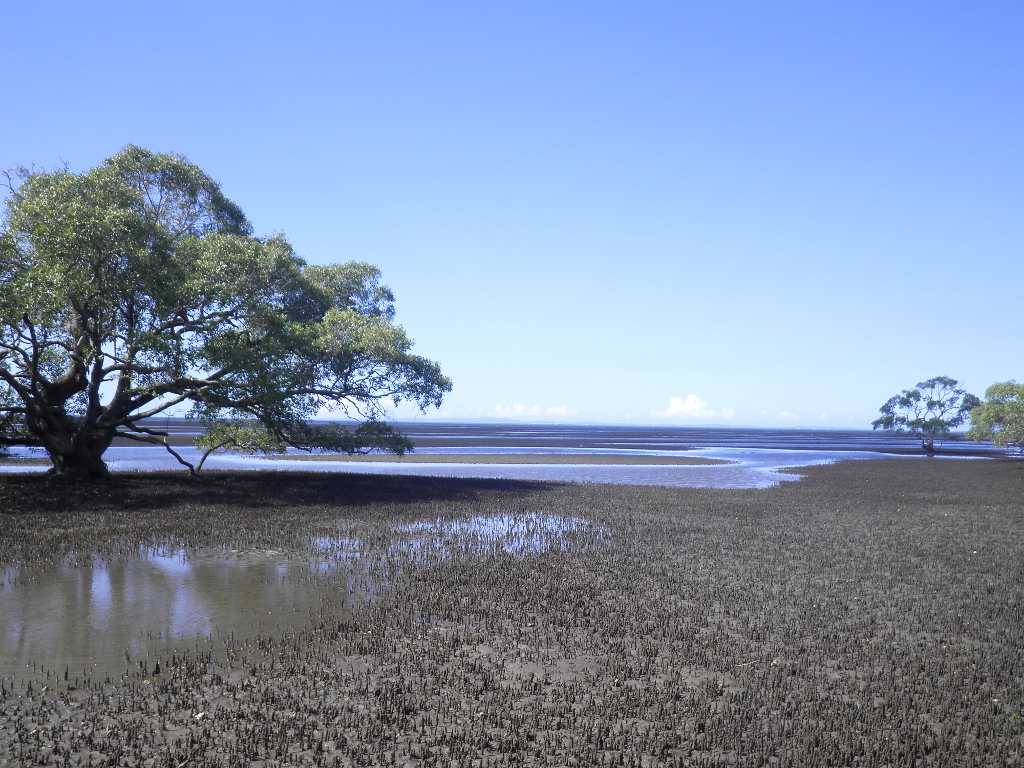
Intertidal ecosystems, including mangrove and saltmarsh communities, provide significant social, cultural, economic and ecological values.
While these communities are currently protected under legislation, they are vulnerable to impacts from coastal development as well as from changes to natural processes such as siltation, nutrient runoff and climate.
Mangrove communities have increased in area by 1,519 ha (10.9%) between 1955 and 2021 whereas saltmarsh communities (including samphire, marine couch and claypan) have lost 6,670 ha (70.4%) of their 1955 extent. Casuarina glauca communities have lost 425 ha (20.5%) of their area during the same period. The spatial extent of each mangrove and associated community are described for the period from 1955 to 2021.
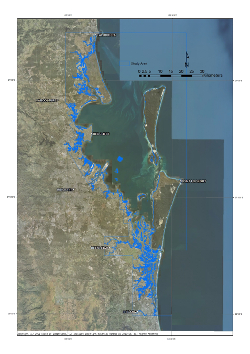
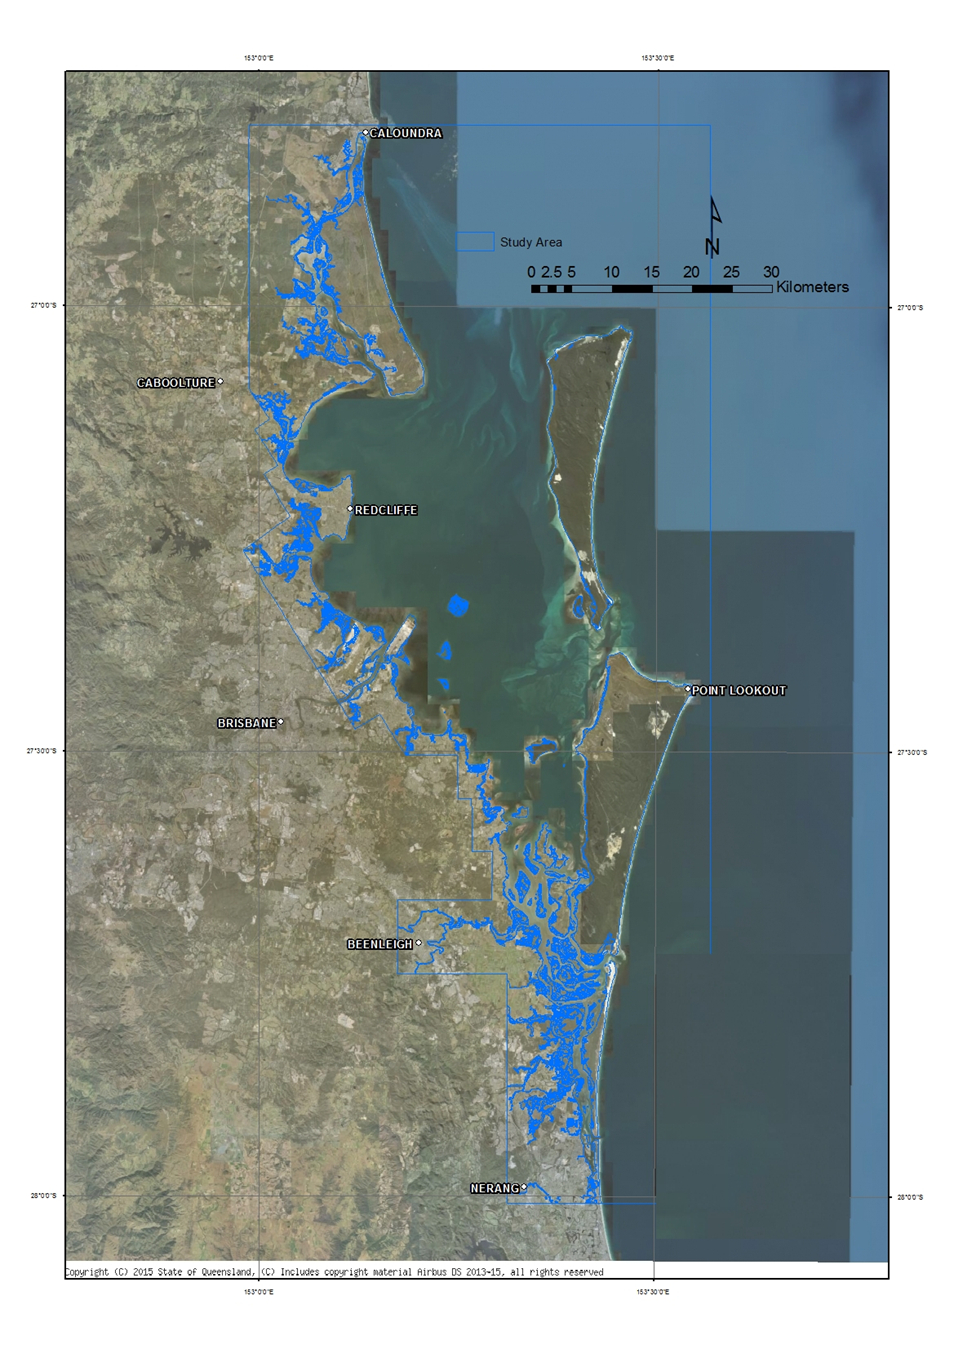
The mangrove and associated communities within Moreton Bay area, Southeast Queensland, have been mapped to the same consistent standards and protocols twice over the last forty years[4][2]. These studies were based on 1974 aerial photographs and 1997 digital ortho photographs respectively. The same mapping classification and scale was applied in the above two studies providing a consistent baseline for monitoring the mangrove and associated communities of Moreton Bay. The floristic and structural classification used in these studies provides an important baseline to assess and quantify changes at a species level within mangrove communities as well as their distribution across Moreton Bay.
This study documents when and where these changes have occurred. To determine changes in the inter-tidal mangrove and associated communities a program of monitoring of these dynamic communities over time has been established. This program assesses both the health and the changes within the mangrove and associated communities within Moreton Bay. In addition to a snapshot in time, longer temporal changes need also to be monitored so that any changes can be understood and put into context. This report documents the change in extent of each mangrove and associated community from 1955 to 2021 for Moreton Bay. Supported by the 1955, 1974[4], 1997[2], and the more recent 2012, 2016 and 2021 mapping, the extent of the Moreton Bay mangrove and associated communities over this time period have been established.
The Dowling and Stephens[2] coastal wetland vegetation classification established a fine scale (some polygon areas are below 1000 square metres) suitable to 1:10 000 scale mapping detailing the structural and floristic variations that cannot be depicted at the 1:25 000 to 1:50 000 scale mapping currently presented in the Regional Ecosystems mapping of Queensland. These units equate to vegetation communities nesting within the existing regional ecosystems. The classification has been extended to incorporate condition and dieback of the different communities. The coastal wetland vegetation mapping delineates the wetland vegetation community extent for 1955, 1997, 2012, 2016 and 2021 using the relevant imagery and photo-pattern of the specific year to capture both the natural dynamics of these communities as well as the impacts of anthropogenic disturbance. This method has many similarities to the Regional Ecosystem mapping methodology[3], but differs in that pre-clearing vegetation communities are not mapped and therefore the classification of vegetation communities from the 1950's to 2021 doesn't always relate to the pre-clearing state. The Regional Ecosystem mapping methodology[3], maps and classifies the pre-clearing regional ecosystem extent, the 1997 remnant extent, and the remnant extent every two years thereafter through to 2019 remnant extent.
Table 1. Mangrove, Saltmarsh, Casuarina glauca and Associated Communities extent over time
| Community Type |
Description |
1955 (ha) |
1997 (ha) |
2012 (ha) |
2016 (ha) |
2020 (ha) |
2021 (ha) |
| Mangrove communities |
|
1A(i)
RE: 12.1.3a
|
Aegiceras corniculatum closed-scrub, open-scrub, low closed-scrub, low open-scrub
|
602
|
533
|
527
|
527
|
527
|
526
|
|
1B(i)
RE: 12.1.3b
|
Avicennia marina subsp. australasica closed-forest, open-forest, woodland, low closed-forest, low open-forest, low woodland, low open-woodland
|
3640
|
4713
|
5007
|
5008
|
5046
|
5043
|
|
1B(i)D
RE: 12.1.3g
|
Dieback impacted: Avicennia marina subsp. australasica closed-forest, open-forest, woodland, low closed-forest, low open-forest, low woodland, low open-woodland |
0
|
1.3
|
13
|
4
|
9.2
|
10.8
|
|
1B(ii)a
RE: 12.1.3b
|
Avicennia marina subsp. australasica closed-scrub, open-scrub
|
4127
|
3868
|
4008
|
3944
|
3926
|
3907
|
|
1B(ii)aD
RE: 12.1.3g
|
Dieback impacted: Avicennia marina subsp. australasica closed-scrub, open-scrub that are dying. For example, due to waterlogging |
12.4 |
71.4 |
20.9 |
22.8 |
41 |
78.4 |
|
1B(ii)b
RE: 12.1.3b
|
Avicennia marina subsp. australasica tall shrubland, tall open-shrubland
|
1021
|
1488
|
1667
|
1707
|
1723
|
1711
|
|
1B(ii)bD
RE: 12.1.3g
|
Dieback impacted: Avicennia marina subsp. australasica tall shrubland, tall open-shrubland that are dying |
0
|
0
|
0.5
|
3.1
|
3.4
|
3.8
|
|
1B(iii)
RE: 12.1.3b
|
Avicennia marina subsp. Australasica low open-scrub, low shrubland, low open-shrubland
|
1151
|
983
|
900
|
976
|
1098
|
1095
|
|
1B(iii)D
RE: 12.1.3g
|
Dieback impacted: Avicennia marina subsp. Australasica low open-scrub, low shrubland, low open-shrubland that are dying |
0
|
0
|
0
|
0.7
|
1.0
|
4.8
|
|
1C(i)
RE: 12.1.3c
|
Bruguiera gymnorhiza closed-forest, open-forest, low closed-forest, low open-forest
|
9
|
9
|
9
|
9
|
9
|
9
|
|
1C(i)D
RE: 12.1.3g
|
Dieback impacted: Bruguiera gymnorhiza closed-forest, open-forest, low closed-forest, low open-forest that are dying |
0
|
0
|
0.9
|
0
|
0
|
0
|
|
1C(ii)
RE: 12.1.3c
|
Bruguiera gymnorhiza - Casuarina glauca closed-forest, open-forest
|
3
|
3
|
3
|
3
|
3
|
3
|
|
1D(i)
RE: 12.1.3d
|
Ceriops australis closed-scrub, open-scrub, tall shrubland, tall open-shrubland
|
896
|
894
|
801
|
797
|
793
|
793
|
|
1D(i)D
RE: 12.1.3g
|
Dieback impacted: Ceriops australis closed-scrub, open-scrub, tall shrubland, tall open-shrubland that are dying |
0
|
0
|
10.6
|
12.9
|
12.9
|
12.9
|
|
1D(ii)
RE: 12.1.3d
|
Ceriops australis low open-scrub, low shrubland, low open-shrubland |
477
|
362
|
360
|
347
|
347
|
348
|
|
1D(ii)D
RE: 12.1.3g
|
Dieback impacted: Ceriops australis low open-scrub, low shrubland, low open-shrubland that are dying |
0
|
0
|
15.7
|
8.3
|
8
|
7.1
|
|
1E(i)
RE: 12.1.3e
|
Rhizophora stylosa closed-scrub, open-scrub, tall shrubland, tall open-shrubland |
835
|
800
|
833
|
820
|
831
|
831
|
|
1E(i)D
RE: 12.1.3g
|
Dieback impacted: Rhizophora stylosa closed-scrub, open-scrub, tall shrubland, tall open-shrubland that are dying |
0
|
0
|
1.1
|
12.4
|
0.4
|
0.4
|
|
1F(i)
RE: 12.1.3a/12.1.3e/12.1.3c
|
Aegiceras corniculatum - Avicennia marina subsp. australasica - Rhizophora stylosa - Bruguiera gymnorhiza closed-scrub, open-scrub, low closed-scrub, low open-scrub
|
184
|
149
|
150
|
150
|
151 |
151 |
|
1F(ii)
RE: 12.1.3b/12.1.3a
|
Avicennia marina subsp. australasica - Aegiceras corniculatum closed-scrub, open-scrub
|
1005
|
1022
|
1050
|
1048
|
1052
|
1052
|
|
1F(ii)D
RE: 12.1.3g
|
Dieback impacted: Avicennia marina subsp. australasica - Aegiceras corniculatum closed-scrub, open-scrub that are dying |
0
|
0
|
2
|
2.1
|
1.2
|
1.2
|
|
Total Mangrove (Live)
|
|
13950
|
14824
|
15315
|
15336
|
15506
|
15469
|
| Saltmarsh communities (including samphire, marine couch and claypan) |
|
2
RE: 12.1.2
|
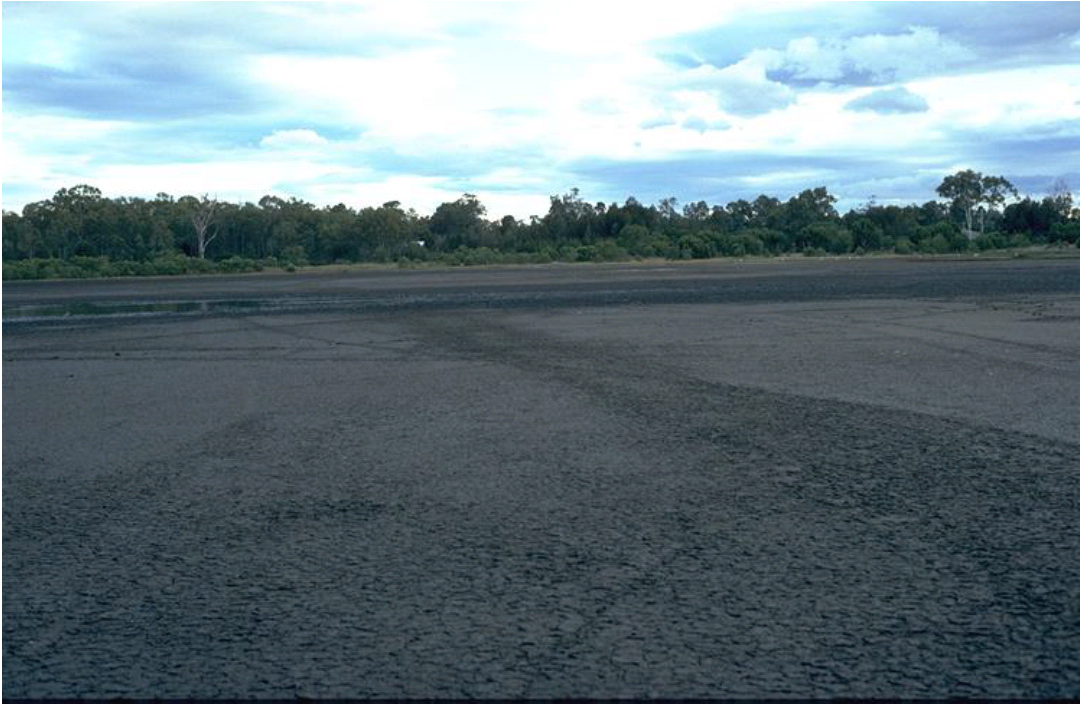
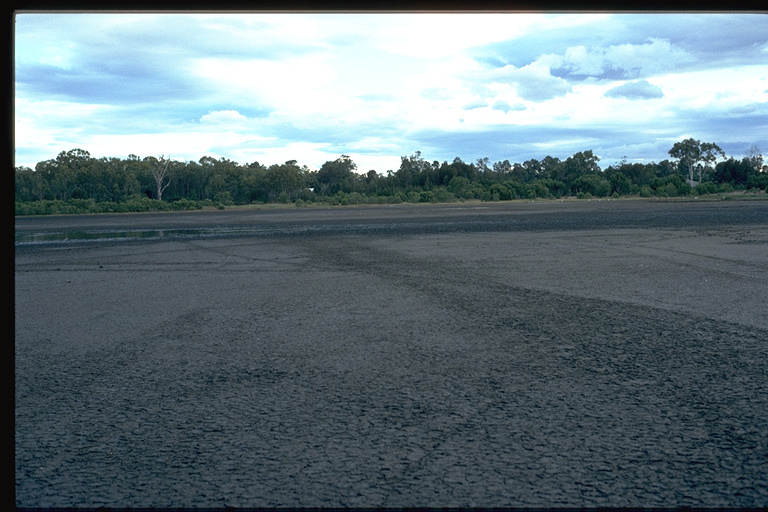
Claypan of marine clay. Usually devoid of vegetation
|
2990
|
1632
|
1437
|
1349
|
1262
|
1258
|
|
3A(i)
RE: 12.1.2
|
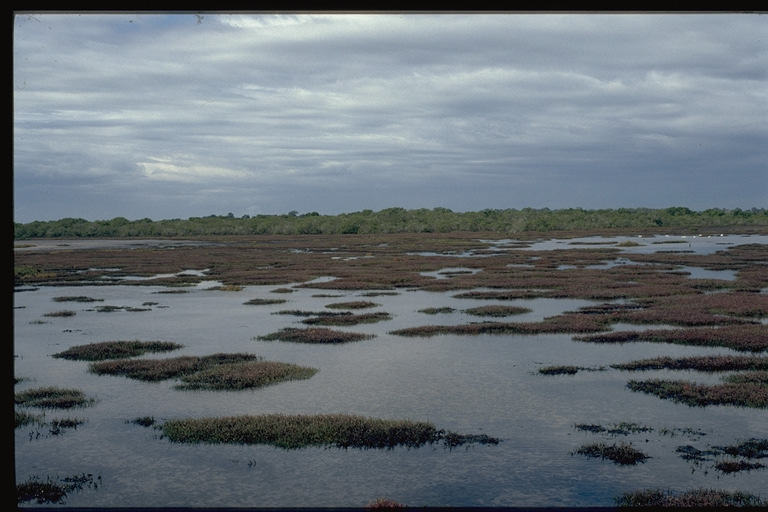
Salicornia spp. - Suaeda australis - Suaeda arbusculoides succulent shrubland to open-succulent shrubland
|
1406
|
579
|
423
|
408
|
375
|
374
|
|
4A(i)
RE: 12.1.2
|
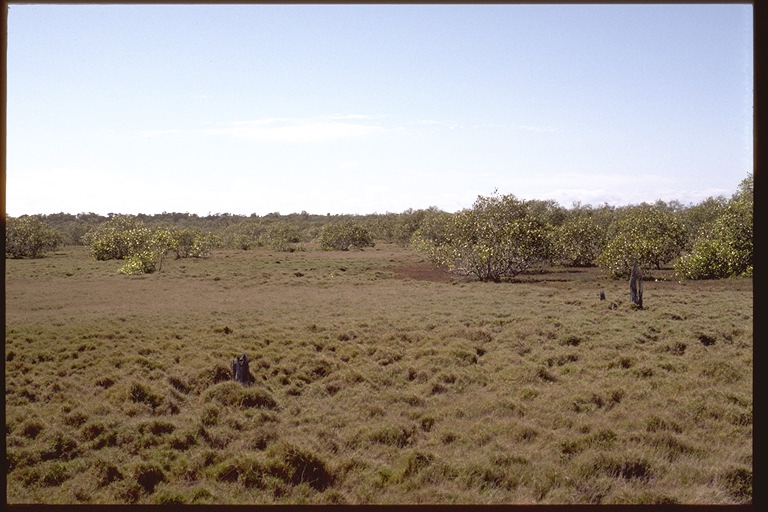
Sporobolus virginicus closed grassland, grassland
|
5004
|
1717
|
1249
|
1163
|
1085
|
1084
|
|
4B(i)
RE: 12.3.8
|
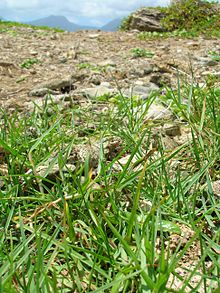
Paspalum vaginatum closed grassland, grassland
|
4
|
3
|
3
|
2
|
2
|
2
|
|
4C(i)
RE: 12.3.8
|
Phragmites australis closed grassland, grassland
|
66
|
112
|
93
|
94
|
82
|
82
|
|
4D(i)
RE: 12.1.2
|
Triglochin striatum - Sporobolus virginicus closed grassland, grassland
|
0
|
22
|
0
|
0
|
0
|
0
|
|
Total saltmarsh
|
|
9470
|
4065
|
3205
|
3016
|
2806
|
2800
|
| Casuarina glauca communities |
|
5A(i)a
RE: 12.1.1
|
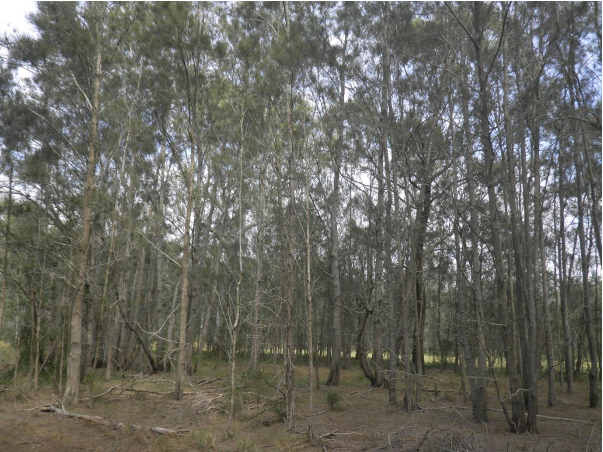
Casuarina glauca open-forest, woodland |
469
|
740
|
837
|
852
|
837
|
837
|
|
5A(i)aD
|
Dieback impacted: Casuarina glauca open-forest, woodland that are dying |
0
|
0.4
|
12.8
|
19.5
|
52.7
|
52.7
|
|
5A(i)b
RE: 12.1.1
|
Casuarina glauca open-woodland
|
89
|
36
|
72
|
67
|
63
|
63
|
| 5A(i)bD |
Dieback impacted: Casuarina glauca open-woodland that are dying |
0 |
0 |
0 |
1.3 |
5 |
4.9 |
|
5A(ii)a
RE: 12.1.1
|
Casuarina glauca low open-forest, low woodland
|
808
|
512
|
380
|
397
|
406
|
407
|
|
5A(ii)aD
|
Dieback impacted: Casuarina glauca low open-forest, low woodland that are dying |
0
|
5.7
|
2.4
|
2.5
|
14.1
|
14.1
|
|
5A(ii)b
RE: 12.1.1
|
Casuarina glauca low open-woodland |
475
|
128
|
108
|
88
|
87
|
87
|
|
5A(ii)bD
|
Dieback impacted: Casuarina glauca low open-woodland that are dying |
0
|
1.8
|
7.3
|
10.1
|
8.5
|
8.5
|
|
5B(i)
RE: 12.1.1/12.3.5
|
Casuarina glauca - Melaleuca quinquenervia open-forest, woodland, low open-forest |
157
|
202
|
180
|
184
|
186
|
185
|
|
5B(ii)
RE: 12.1.1/12.3.5
|
Casuarina glauca - Melaleuca quinquenervia open-forest, low open-forest (dying) |
56
|
41
|
34
|
34
|
34
|
34
|
|
5C(ii)
RE: 12.1.1/12.1.3b
|
Casuarina glauca - Avicennia marina subsp. australasica low open-forest
|
9
|
7
|
6
|
5
|
5
|
5
|
|
5C(iii)
RE: 12.1.1/12.1.3b/12.1.3a
|
Casuarina glauca - Avicennia marina subsp. australasica - Aegiceras corniculatum open-forest, woodland
|
8
|
13
|
26
|
28
|
28
|
28
|
|
6A(i)#
RE: 12.2.15
|
Juncus kraussii- Baloskion pallens closed-sedgeland, sedgeland |
|
|
|
|
|
|
|
Total Casuarina glauca (Live)
|
|
2071
|
1679
|
1643
|
1655
|
1646
|
1646
|
| Other |
| 9# |
Other non-wetland vegetation communities or rural/urban areas, cleared, plantation |
|
|
|
|
|
|
| Water |
|
10A(i)b Free standing water – saline and brackish
RE: 12.1.3f
|
|
190 |
229 |
247 |
275 |
252 |
253 |
|
Total
|
|
25681
|
20797
|
20410
|
20282
|
20210
|
20168
|
| # Not monitored or not in the study area |
Changes in extent of mangrove communities from 1955 to 2021
- 10,926 ha were stable
- 3,039 ha either changed to another community type or were lost due to anthropogenic causes
- 3,863 ha were gained as a result of encroachment
- some mangrove community types have increased in area where others have decreased in extent
- 1,519 ha overall net gain of mangroves
- mangrove encroachment into saltmarsh and Casuarina glauca communities was 2,964 ha in the 1955 - 1997 period in comparison to 679 ha, 138 ha, and 204 ha in the period 1997-2012; 2012-2016; 2016-2021 respectively.
Changes in extent of mangrove communities from 2016 to 2021
- During the period 2016-2021 there was net gain of 164 ha of mangrove communities in Moreton Bay. That is 40 ha loss of mangrove communities (32%) losses due to anthropogenic causes mainly in Brisbane City government area (75%) predominantly due to road works. Mangrove losses due to change to other community type such as: free standing water – saline and brackish community 47%, saltmarsh communities 21% and Casuarina glauca communities 0.2%.
- During this period 204 ha of mangrove communities were gained by encroachment into: saltmarsh communities 93%; free standing water – saline and brackish community 22%; Casuarina glauca communities 4%; and other 3%. These mangrove communities gained by encroachment into other communities occurred in the Moreton Bay Regional 16%, Brisbane City 24%, Gold Coast 16%, Redland 12% and Sunshine Coast 5%.
Changes in extent of saltmarsh communities including samphire, marine couch and claypan from 1955 to 2021

- Moreton Bay saltmarsh communities are part of the subtropical and temperate coastal saltmarsh ecological communities that are listed as vulnerable under the Commonwealth EPBC Act 1999
- 2,345 ha were stable
- 7,223 ha either changed to another community type or were lost due to anthropogenic causes
- 479 ha were gained by dieback of other community types
- there was a large decrease across all the saltmarsh community types
- 6,670 ha overall net loss
- saltmarsh community invasion by mangrove and Casuarina glauca communities was 3,159 ha in the 1955–1997 period in comparison to 824 ha, 163 ha and
226 ha in the period 1997-2012, 2012-2016 and 2016–2021 respectively.
Changes in extent of saltmarsh communities including samphire, marine couch and claypan from 2016 to 2021
- During the period 2016-2021 there was 226 ha loss and 28 ha gain leading to a net loss of 198 ha of Saltmarsh communities in Moreton Bay. That is 83.2% loss due to mangrove communities’ encroachment; 8.3% by encroachment of Casuarina glauca communities; 7.2% as a result of ponding and changing to free standing water – saline and brackish community and 1.3% losses due to anthropogenic causes mainly roads. Loss occurred in the Moreton Bay Regional 40%,
Gold Coast 28% Brisbane City 20%, Redland 8%, and Sunshine Coast 3% local government areas.
- 14 ha of saltmarsh community gain were as a result of encroachment: free standing water – saline and brackish community 33%, Casuarina glauca communities 30.4%, mangrove communities 29.2%, and other 7.1%.
Changes in extent of Casuarina glauca communities from 1955 to 2021
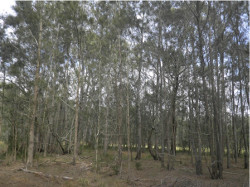
- Moreton Bay Casuarina glauca communities are listed as Endangered under the Commonwealth EPBC Act 1999 as part of the Forest of New South Wales and South East Queensland ecological communities
- 963 ha were stable
- 1,108 ha either changed to another community type or lost due to anthropogenic causes
- 761 ha were gained by encroachment
- some Casuarina glauca communities have decreased in area where others increased
- 425 ha overall net loss
- Casuarina glauca communities’ encroachment into mangrove and saltmarsh communities was 459 ha in the 1955-1997 period in comparison to
179 ha, 33 ha and 25 ha in the period 1997–2012, 2012-2016 and 2016-2021 respectively.
Changes in extent of Casuarina glauca communities from 2016 to 2021
- During the period 2016-2021 there was 15.2 ha losses and 49 ha gain leading to a net gain of 34 ha, of Casuarina glauca communities in Moreton Bay. That is, loss of Casuarina glauca communities due to; 56.1% encroachment of saltmarsh communities, 14.9% encroachment of other grasses and Melaleuca spp., 14.4% mangrove communities’ encroachment, 10.1% due to anthropogenic causes, and 4.6% ponding and free standing water – saline and brackish community. The loss of Casuarina glauca communities have occurred mainly in Gold Coast (63%), Moreton Bay (24%) and Brisbane (9%) local government areas.
- 49 ha gain by encroachment: other grasses and Melaleuca spp. communities 58%, saltmarsh 41%, and mangrove communities and free standing water – saline and brackish community 1%. The gain oCasuarina glaucacommunities have occurred mainly in Gold Coast (68%), Moreton Bay (21%) and Sunshine coast (4%) local government areas.
References
- ^ Accad, A, Li, J, Dowling, R & Guymer, G (2016), Mangrove and associated communities of Moreton Bay, Queensland, Australia: change in extent 1955-1997-2012. [online], Queensland Herbarium, Brisbane. Available at: https://www.publications.qld.gov.au/dataset/mangrove-and-associated-communities-of-moreton-bay.
- ^ a b c Dowling, R & Stephens, K (2001), Coastal Wetlands of South East Queensland. mapping and Survey, February 2001., vol. 1, Queensland Government Environmental Protection Agency, Brisbane.
- ^ a b Neldner, VJ, Wilson, BA, Dillewaard, HA, Ryan, TS, Butler, DW, McDonald, WJF, Richter, D, Addicott, EP & Appelman, CN (2022), Methodology for surveying and mapping regional ecosystems and vegetation communities in Queensland - Version 6.0. [online], p. 143, Queensland Herbarium, Department of Environment and Science. Available at: https://www.publications.qld.gov.au/dataset/redd/resource/6dee78ab-c12c-4692-9842-b7257c2511e4.
- ^ a b R.M. Dowling (1986), The Mangrove Vegetation of Moreton Bay, vol. 6, Queensland Department of Primary Industries, Brisbane.
Last updated: 27 October 2022
This page should be cited as:
Department of Environment, Science and Innovation, Queensland (2022) Mangroves and associated communities of Moreton Bay, WetlandInfo website, accessed 18 March 2024. Available at: https://wetlandinfo.des.qld.gov.au/wetlands/ecology/components/biota/flora/flora-structural/mangroves/mangrove-moreton.html
|


 — Department of Environment, Science and Innovation