

|
|
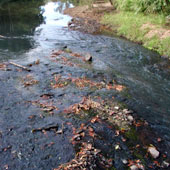
South-East Freshwater Biogeographic ProvinceSouth-East Freshwater Biogeographic Province – Climate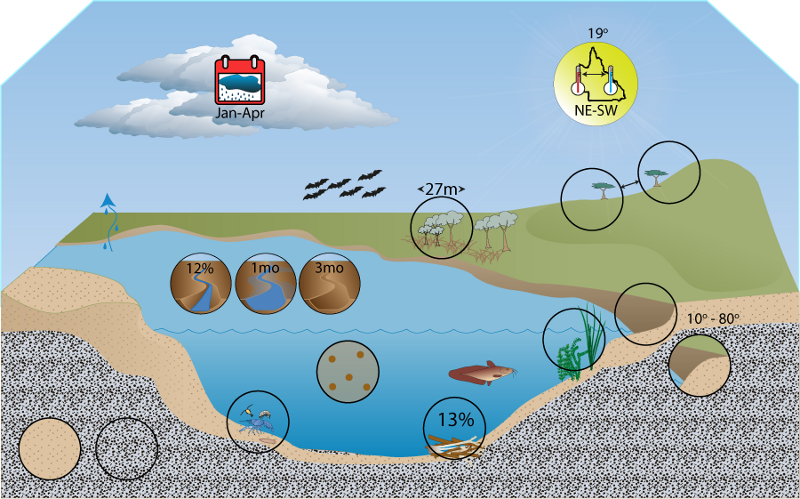 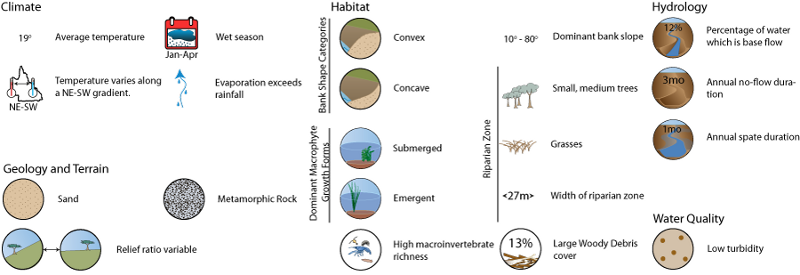 Click on elements of the model or select from the tabs below Rainfall Annual mean precipitation is moderate to high throughout the FBP, with a mean of 916 mm and a maximum of 3081 mm. An obvious east to west gradient exists for annual mean precipitation, with areas in close proximity to the coast receiving the highest rainfall. The values for the driest quarter precipitation are high throughout the FBP, with a mean of 109 mm. Areas in the north-west of the FBP have slightly lower values (with a minimum of 73 mm recorded) in comparison to the coastal and southern parts of the FBP. Rainfall erosivity, the potential for rainfall induced soil loss[1] ranges from low to high throughout the FBP, with rainfall erosivity decreasing as distance from the coast increases. Areas of the FBP that receive the highest annual mean precipitation have the highest rainfall erosivity values. Precipitation results in lateral run-off from the surrounding catchments into rivers, supplying water, sediment, nutrients and debris (allochthonous inputs) to the system. The moderate to high volume of rainfall in this FBP suggests a moderate to high potential rate and volume of input.
Summary Maps of FBP Rainfall State Rainfall Map Temperature
The annual mean temperature for the South-East FBP ranges from cool to cold, with the warmer areas located near the coast. Values for the highest weekly mean maximum temperature are similar throughout the FBP. The highest value for this statistic recorded in the FBP is 32.6 °C. Values for the lowest mean minimum temperature ranged throughout the FBP from low to moderate. There appears to be a gradient related to distance from the coast, with the coastal areas of the FBP experiencing higher temperatures than those further inland. The ratio of hottest weekly maximum to coldest weekly minimum values was variable throughout the FBP. Seasonality in temperature is not pronounced in the coastal areas, but is pronounced further inland.
Summary Maps of FBP Temperature State Temperature Map Water Balance
Mean annual run-off in most of the FBP, particularly the inland areas is low; suggesting most of the rainfall is lost as evaporation. Mean annual run-off along the coast and in the southern sections of the FBP ranges from low to high.
Information about water balance
References
Last updated: 22 March 2013 This page should be cited as: Department of Environment, Science and Innovation, Queensland (2013) South-East Freshwater Biogeographic Province – Climate, WetlandInfo website, accessed 18 March 2024. Available at: https://wetlandinfo.des.qld.gov.au/wetlands/ecology/aquatic-ecosystems-natural/riverine/freshwater-biogeo/south-east/climate.html |

Site footer

 — Department of Environment, Science and Innovation