

|
|
Wet Tropics Freshwater Biogeographic ProvinceWet Tropics Freshwater Biogeographic Province – Habitat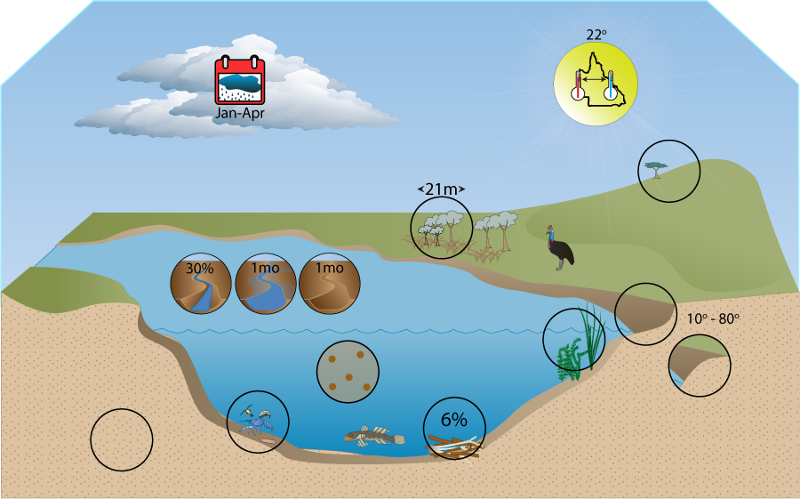 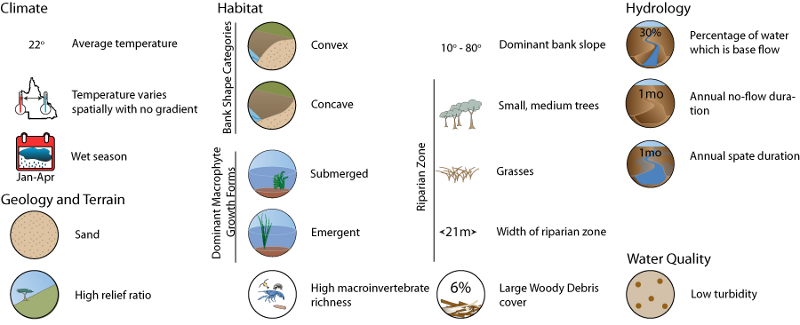 Click on elements of the model or select from the tabs below Bank shape and slope
State of the Rivers survey data from 190 reference sites show that all bank slope categories are present in the FBP and also represent the predominant category at 9% or more of sites. Moderate slope is the category dominant at the highest proportion of sites, with steep and low slope also often dominant. All shape categories also occur, but stepped, wide lower bench and undercut shaped banks occur at less than 10% of sites and are rarely dominant. Convex and concave are the most often present and most often dominant shaped banks in the FBP. Information about bank shape and slope
Riparian vegetation and macrophyte (aquatic plant)State of the Rivers survey data from 190 reference sites in the FBP show that the average width of riparian zones is approximately 20 m. Medium and small trees, woody shrubs and grasses typically dominate riparian vegetation cover. Trees over 30 m tall, vines, herbs and forbs, rushes and sedges, tree ferns, mosses, palms, and ferns typically form minor components of riparian cover but all are typically present. Riparian zones are on average 14 to 16% bare of vegetation. The vegetation surrounding riparian zones is often lush tropical forest and it is not always clear where the riparian zone finishes and terrestrial forest begins. Information about Riparian Vegetation and Macrophytes
Macrophyte (aquatic plant)State of the Rivers survey data from 190 reference sites in the FBP show that macrophytes were present at 81% of sites in the Wet Tropics FBP. Mean total cover is 13 to 17% which is typically dominated by submerged growth forms. Riparian vegetation provides nutrients and debris inputs to the stream, habitat, and bank stabilisation. Leaf litter derived from riparian vegetation is an important food source in these systems. Riparian shading is generally considerable and significant in this FBP, and epilithic diatoms that thrive in the flowing, clear, low light intensity waterways typical of the Wet Tropics FBP are another significant food source for aquatic food webs. Riparian micro-climates may be important for adult flying stages of aquatic insects, but in many cases terrestrial forests fringing riparian vegetation have similar microclimates to those in the riparian zone. Submerged plants are common in the Wet Tropics FBP, as light is not restricting . Submerged plants provide habitat and food for macroinvertebrates and fish, and are also potential sites for fish egg attachment. Submerged plants are also a substrate for the attachment of epiphytes such as algae. A diversity of macrophytes provides a diversity of habitats for aquatic organisms. Leaves, large woody debris and snags derived from riparian vegetation provide cover for stream biota such as fish and macroinvertebrates, and also substrate for diatoms and algae. There are however often other hard substrates (rock) available in Wet Tropics streams and rivers.
Substrate composition and heterogeneityThe number of substrate classes recorded from sites in the Wet Tropics FBP is high with respect to most other FBPs in Queensland. An average of three classes were recorded from edge habitat with a range of one to seven classes. Pool habitats averaged four classes and ranged from one to six, while riffle habitat averaged four classes and ranged from one to seven.
Information about Substrate Composition and Heterogeneity
Macroinvertebrate RichnessSubstrate heterogeneity is consistent between habitat types in the Wet Tropics FBP and is high compared to other FBPs in Queensland. High substrate heterogeneity and the availability of hard substrate, is likely to be a major contributor to the high macroinvertebrate diversity in the Wet Tropics in comparison with some other FBPs. There are significant correlations in this FBP between macroinvertebrate sample richness in edge and riffle habitat and both substrate heterogeneity and number of substrate classes present, but no significant correlations for pool habitat, although over the entire state these are also significantly correlated. Table: Results of Pearson’s correlations between substrate heterogeneity and number of substrate classes present with macroinvertebrate sample richness from ABMAP reference sites in the Wet Tropics FBP. Significant p values (<0.05) are indicated in italics.
Information about macroinvertebrate richness Woody debris and snagsLarge Woody Debris (LWD) and snags are conspicuous components of many rivers in the FBP. State of the Rivers survey data from 187 reference sites in the FBP show that on average there are 60 to 70 items of LWD and snags per kilometre reach of river and that these cover 5.5 to 6.5% of the river bed. In extreme cases there can be no LWD present up to 1100 items per kilometre covering 70% of the bed. Individual logs and branches are more common than snags (log jams and branch piles). Patches of leaf litter and twigs cover on average 9 to 11% of the stream bed with 50 – 60 patches per kilometre of river. This can range however from no patches to 900 with up to 100% bed cover. Woody debris and leaf litter cover in the wet tropics is generally low (though leaf litter is higher than some other FBPs). This is most likely due to the high levels of flow in the area influencing substrate distribution. The high macroinvertebrate diversity is likely to be mainly dependent on the other types of hard substrate present in the FBP (e.g. rocky substrates) Information about Woody Debris and Snags
Last updated: 22 March 2013 This page should be cited as: Department of Environment, Science and Innovation, Queensland (2013) Wet Tropics Freshwater Biogeographic Province – Habitat, WetlandInfo website, accessed 18 March 2024. Available at: https://wetlandinfo.des.qld.gov.au/wetlands/ecology/aquatic-ecosystems-natural/riverine/freshwater-biogeo/wet-tropics/habitat.html |
||||||||||||||||||||||||||||||||||||||||||||||||||||||||||||||||||||||||||||||||||||||||||||||||||||||||||||||||||||||||||||||||||||||||||||||||||||||||||||||||||||||||||||||||||||||||||||||||||||||||||||||||||||||||||||||||||||||||||||||||||||||||||||||||||||||||||||||||||||||||||||||||||||||||||||||||||||||||||||||||||||||||||||||||||||||||||||||||||||||||||||||||||||||||||||||||||||||||||||||||||||||||||||||||||||||||||||||||||||||||||||
Site footer

 — Department of Environment, Science and Innovation