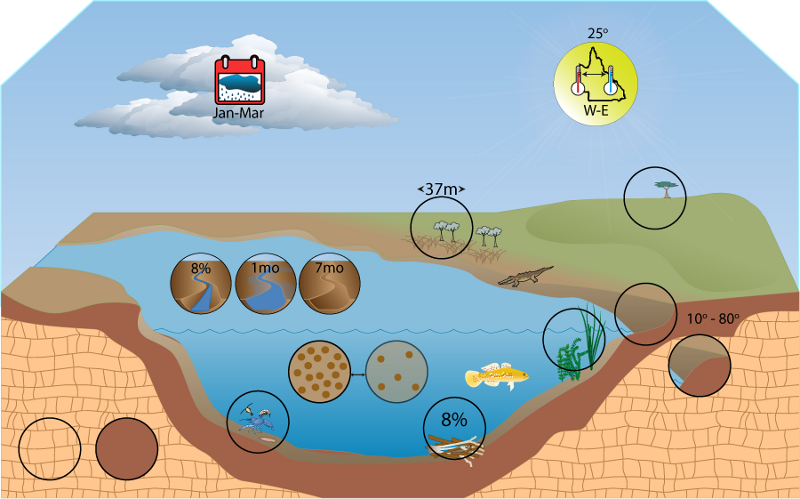
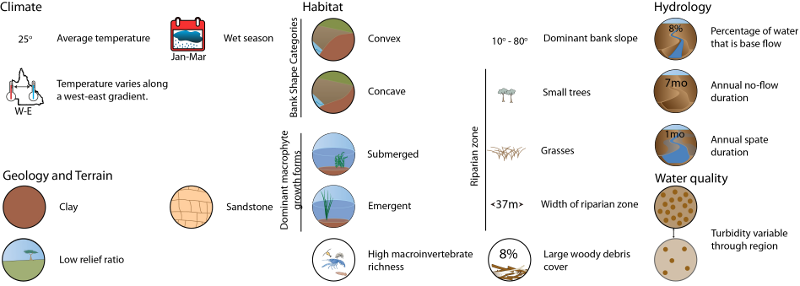
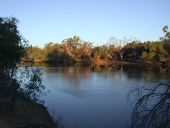
State of the Rivers survey data from 221 reference sites show that all bank slope categories are present in the FBP. Steep, moderate and low slopes are the predominant categories. They occur at 30% of the sites, and represent the dominant categories at 20-30% of sites. All shape categories also occur, the concave and convex classes are most common. In contrast undercut banks occur least frequently (<10% of sites).
Riparian vegetation and macrophyte (aquatic plant)
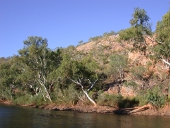
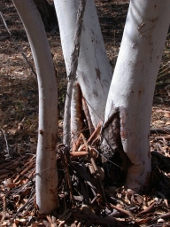
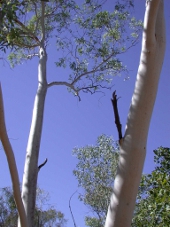
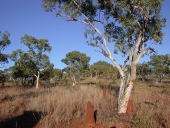
State of the Rivers survey data from 221 reference sites in the FBP show that the average width of riparian zones is approximately 37 m. Grasses, medium trees and small trees typically dominate riparian vegetation cover. Trees over 30 m tall, woody shrubs, ferns, mosses, and palms typically form very minor components of riparian cover and vines, tree ferns, mosses and palms are typically absent. On average 23% of riparian zones are bare of vegetation.
Vegetation type varies across the FBP. In the Cape York Peninsula to the north of the FBP the most extensive vegetation types are woodlands dominated by Eucalyptus tetrodonta, bloodwoods (Corymbia nesophila, C. hylandii, C. clarksoniana), and Melaleuca viridiflora [1]. In contrast the Mitchell Grass Downs contain a high diversity of arid zone fauna, including species which have developed specialisation for high temperatures and deep cracking soils[1].
State of the Rivers survey data from 221 reference sites in the FBP show that macrophytes were present at 34% of sites in the FBP. Mean total cover was 6%, with submerged and emergent macrophytes being most frequently observed, present at 21 and 18% of sites respectively.
Macrophyte cover
% sites present
Mean
SE
Maximum
Minimum
submerged (%)
21.267
6.281
1.192
95
0
floating (%)
4.525
0.706
0.257
30
0
emergent (%)
18.552
3.878
0.755
60
0
total (%)
34.389
10.864
1.443
-
-
Substrate composition and heterogeneity
The number of substrate classes recorded is high with respect to most other FBPs in Queensland. Edge habitat averaged 2.7 classes, pool habitat 3.3 classes, and riffle habitat averaged almost four. In all habitat types each class was represented repeatedly.
Edge habitat is dominated by sand, though silt/clay occurs frequently, and smaller hard substrates (cobble, boulder) typically present as only minor components. At some sites bedrock, sand and silt/clay are the only substrate classes present but no class is present at all sites.
Pool bed material is dominated by sand, but bedrock and gravel are also typically common (>10%), while boulder, cobble, pebble, and silt/clay are relatively uncommon (<10%). At some sites bedrock, silt/clay and sand are the only substrate class present but no class is present at all sites.
Riffles contain a mixture of cobble, pebble, gravel, and sand though are not dominated by any one substrate type. Silt/clay and boulder are very minor components and bedrock is a relatively minor component. Despite this at some sites bedrock composes 95% of the substrate but no class is present at all sites.
Substrate heterogeneity is consistent between habitat types and is high compared to other FBPs in Queensland.
High substrate heterogeneity and the availability of hard substrate is likely to contribute to high macroinvertebrate diversity in the Western Cape and Gulf FBP. There are significant correlations in this FBP between macroinvertebrate sample richness in edge and riffle habitat for both substrate heterogeneity and number of substrate classes present.
Table: Results of Pearson’s correlations between substrate heterogeneity and number of substrate classes present with macroinvertebrate sample richness from ABMAP reference sites in the Wet Tropics FBP. Significant p values (<0.05) are indicated in italics.
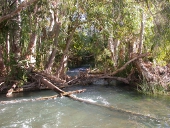
State of the Rivers survey data from 221 reference sites in the FBP show that on average there are approximately 56 items of LWD and snags per kilometre of river, which cover about 7-9% of the river bed. Large woody debris (LWD) density is made up primarily of individual logs, branches, and small branch piles.
Patches of leaf litter and twigs cover on average 14% of the stream bed with 13-16 patches per kilometre of river. This can range however from no patches to 180 with 100% bed cover.
Department of Environment, Science and Innovation, Queensland (2013) Western Cape and Gulf Freshwater Biogeographic Province – Habitat, WetlandInfo website, accessed 18 March 2024. Available at: https://wetlandinfo.des.qld.gov.au/wetlands/ecology/aquatic-ecosystems-natural/riverine/freshwater-biogeo/western-cape-and-gulf/habitat.html


 — Department of Environment, Science and Innovation