

|
|
Queensland Lake Eyre and Bulloo Freshwater Biogeographic ProvinceQueensland Lake Eyre and Bulloo Freshwater Biogeographic Province – Climate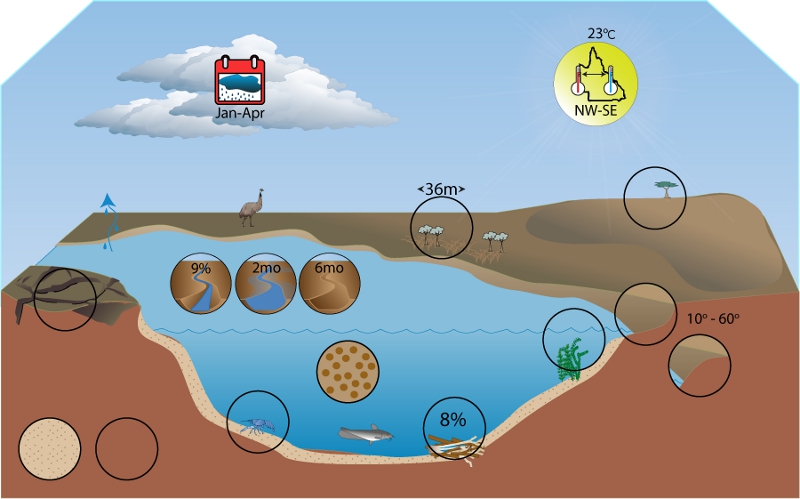 Click on elements of the model or select from the tabs below
Rainfall
Rainfall in the FBP is influenced by the northern Australia summer monsoon and linked with the El Nino and La Nina climate patterns. Summer rainfall (and consequent winter drought) is associated with the northern regions of the Lake Eyre Basin and heavy rains produce flooding which flows downstream into arid areas. The areas of the FBP in central Australia are arid desert systems. Rainfall is more variable along the northern and eastern boundaries, though conditions are still primarily dry. Areas located in the north-east of the FBP receive the highest annual mean precipitation. This is demonstrated by the Bulloo catchment, in the south-east of the FBP, which is categorised as hot and persistently dry with grasslands to its north and arid desert at its southern end[1]. A central-west to north-east gradient exists for annual mean precipitation, ranging from dry to moderate. The driest quarter mean precipitation forms three bands, ranging from dry to moist in an easterly direction. As expected with the scarcity of widespread rainfall, the potential for rainfall induced soil loss[2] is very low throughout the FBP.
Temperature
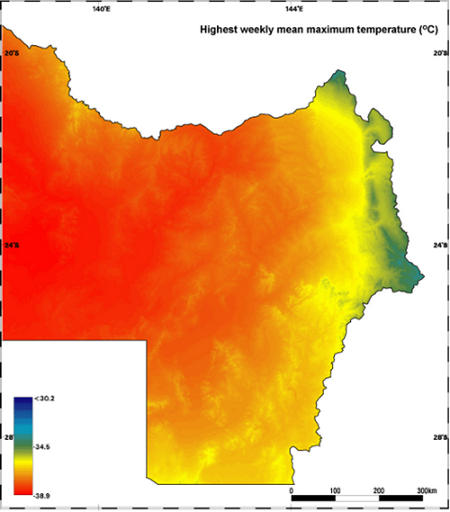
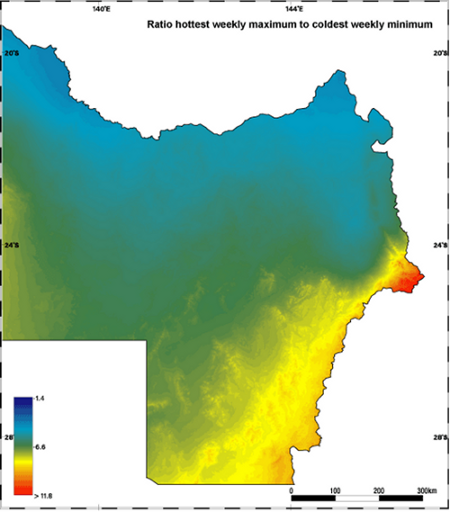
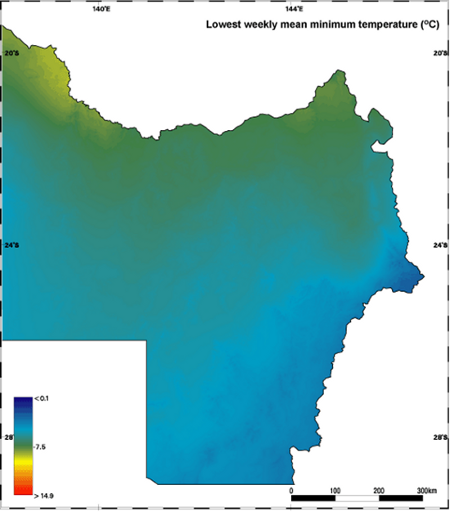
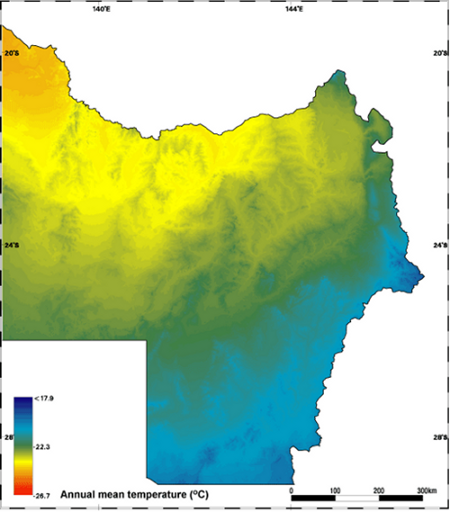
The central zone of the FBP is hot, arid desert with temperatures more variable along the northern and eastern margins of the FBP. Three broad bands of differing temperatures are represented amongst the annual mean averages. These divisions are roughly influenced by dry grassland areas to the east of the FBP and the hot deserts of the interior. Warmer temperatures occur in the north-west in contrast to the cooler temperatures toward the south-east of the FBP. The highest weekly mean maximum temperatures show that hot temperatures are widespread, the hottest temperatures occurring in the arid inland northern and western regions of the FBP. Temperatures become cooler towards the east, especially along the north-eastern margins of the FBP. The lowest temperatures in the FBP are experienced at the eastern most point, just below latitude 24o S. This same location contains the largest temperature differences for the FBP. There is likely to be more pronounced seasonality in the south-east area where there are larger temperature differentials.
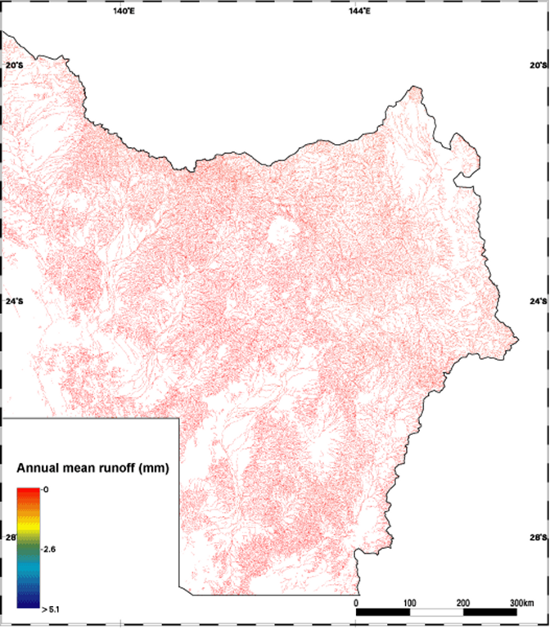
Water balanceMean annual run-off in the FBP is negligible (0.07 mm) and the lowest amongst Queensland’s FBPs. Historically most rainfall which occurred across the FBP was lost as evaporation.
References
Last updated: 22 March 2013 This page should be cited as: Department of Environment, Science and Innovation, Queensland (2013) Queensland Lake Eyre and Bulloo Freshwater Biogeographic Province – Climate, WetlandInfo website, accessed 18 March 2024. Available at: https://wetlandinfo.des.qld.gov.au/wetlands/ecology/aquatic-ecosystems-natural/riverine/freshwater-biogeo/lake-eyre-and-bulloo/climate.html |


Site footer

 — Department of Environment, Science and Innovation