

|
|
Queensland Lake Eyre and Bulloo Freshwater Biogeographic ProvinceQueensland Lake Eyre and Bulloo Freshwater Biogeographic Province – Water quality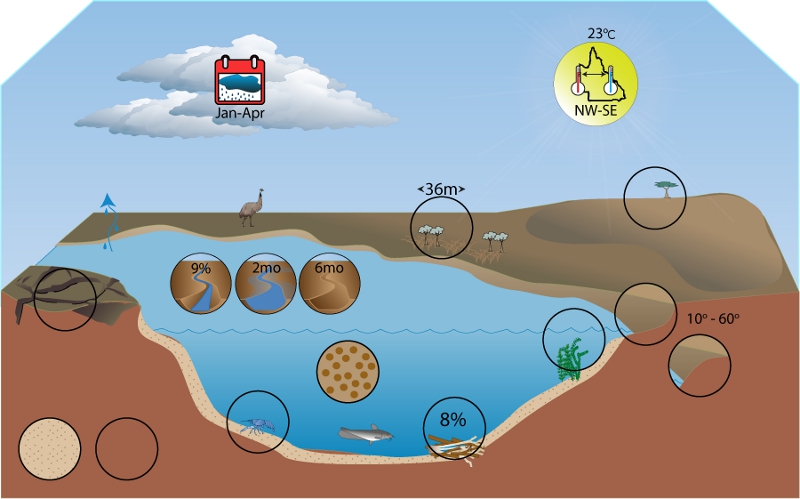 Click on elements of the model or select from the tabs below
TurbidityTurbidity within the Lake Eyre and Bulloo FBP is generally high, but can be low at upland or headwater sites. At lowland sites, turbidity remains high even during the sometimes long periods between flows[2][1]. Average visibility measurements (secchi disc depths) from the Lake Eyre Basin rivers show visibility to be variable between catchments and over time, although there is a slight gradient of decreasing variability and turbidity moving westwards[1]. For more eastern rivers (e.g. Thomson and Barcoo Rivers) the average visibility depth is around 6 cm, ranging between 0.1 - 28cm. Western rivers have an average visibility depth of 4cm in the mid reaches and lower reaches have 6cm with a range of 1 - 12cm[1]. Dispersive soil types and run-off patterns are contributing factors to turbidity in this FBP[1].
Photic depthLight penetration of the water column or photic zone depth is shallow, reflecting the high turbidity of the system. Light is one factor governing rates of in-stream primary production because the growth of most aquatic plants is limited by light availability. Photic depth has been determined for 15 waterholes in the Cooper Creek catchment, shown below, and these results show that incident light can be measured at slightly deeper depths in this system compared with the Murray-Darling FBP[3]. Benthic metabolismArid zone streams and rivers are more metabolically active than temperate systems, with gross primary production one to two orders of magnitude greater[3]. Rates of benthic metabolism in the Lake Eyre and Bulloo FBP have been recorded for dry season habitats and on the inundated floodplains of the Cooper Creek system. During the dry season, a prominent band of epipelic algae in the littoral zone of waterholes has been found to be highly productive. The productivity of littoral zone algae is so prolific that despite low productivity in the deeper water column due to light extinction and only a limited area of littoral zone habitat (< 10%), these waterholes have been found to be net producers of carbon[2]. Rates of primary production associated with phytoplankton can also occasionally be high in the surface waters of these turbid systems, rates ranging from 1.5 mg C L-1 day-1 to 500 mg C L-1 day-1, have been measured during extended periods of no-flow[3]. During inundation of the vast floodplains of the Cooper Creek system warm, slow-flowing waters transform the terrestrial landscape into a shallow ‘lake’ with productivity increasing with inundation time[4].
References
Last updated: 22 March 2013 This page should be cited as: Department of Environment, Science and Innovation, Queensland (2013) Queensland Lake Eyre and Bulloo Freshwater Biogeographic Province – Water quality, WetlandInfo website, accessed 18 March 2024. Available at: https://wetlandinfo.des.qld.gov.au/wetlands/ecology/aquatic-ecosystems-natural/riverine/freshwater-biogeo/lake-eyre-and-bulloo/water-quality.html |
Site footer

 — Department of Environment, Science and Innovation