

|
|
Queensland Lake Eyre and Bulloo Freshwater Biogeographic ProvinceQueensland Lake Eyre and Bulloo Freshwater Biogeographic Province – Hydrology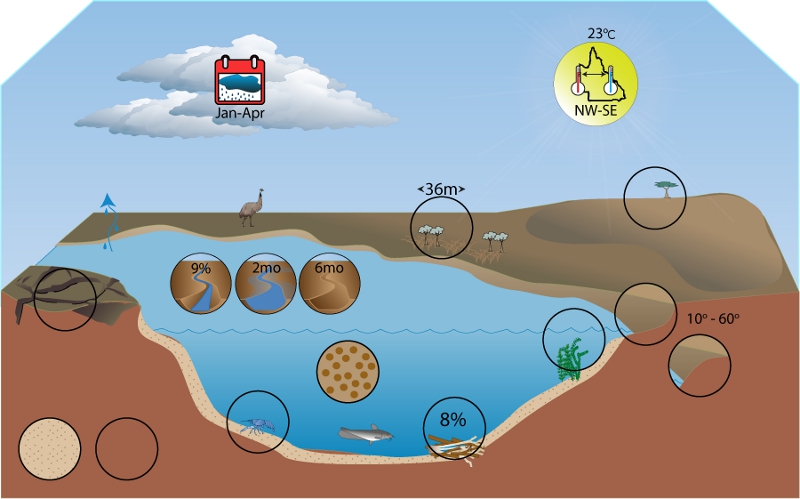 Click on elements of the model or select from the tabs below
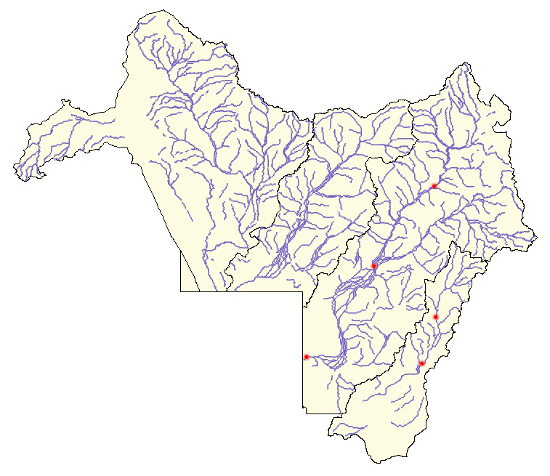
GaugesModelled pre-development data from 5 gauges were used for these analyses.
Gauging stations used in calculation of the Lake Eyre and Bulloo FBP hydrological features
Base flow and flood flowOn average base flow only accounts for 9% of flow volume, whilst the other 91% is directly related to flood flow from rainfall events. The difference was most pronounced at the Quilpie gauging station where only 5% of flow was base flow.
Magnitude of spatesDue to the large sizes of the catchment areas and the strong bias to extremes of flow, spates result in very low run-off values at 0.002 Ml km2 day-1. The FBP has a wide amount of variability in spate number, ranging from 2.3 to 3.3 spates per year. These spates are distributed relatively evenly between the wet and dry seasons. On average the wet season has 1.3 – 2.1 spates whereas the dry season has 1.1 – 2.3. The average duration of spates is also quite variable, ranging from 11 to 27 days on average.
Information about magnitude of spates
No flow spellsOn average a single no-flow spell lasts for 84 days and sites in the FBP have 2 - 3 per year. Duration of no-flow spells range from approximately 65 - 105 days with a similar period of time separating the spells. It should be noted that some of the variability in the presented facts is probably due to the low number of gauging stations affecting confidence in the results.
Information about no flow spells
Rise and fall of the hydrographThe mean rate of rise for the FBP is approximately double the mean rate of fall. The averages for the greatest rates of rise and fall were roughly equal.
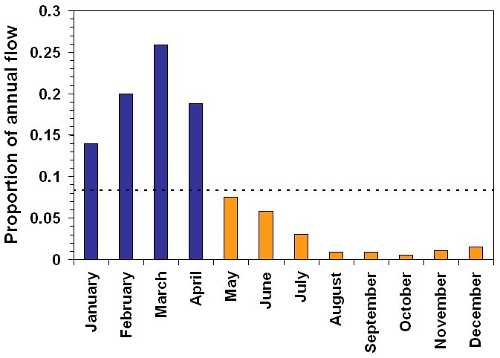
Wet and dry seasonsThe proportion of annual flow is not distributed evenly between months. The months January to April have a much greater proportion of annual flow than May to December. Based on this the wet season for the Lake Eyre and Bulloo FBP is January to April and the dry season May to December.
Last updated: 22 March 2013 This page should be cited as: Department of Environment, Science and Innovation, Queensland (2013) Queensland Lake Eyre and Bulloo Freshwater Biogeographic Province – Hydrology, WetlandInfo website, accessed 18 March 2024. Available at: https://wetlandinfo.des.qld.gov.au/wetlands/ecology/aquatic-ecosystems-natural/riverine/freshwater-biogeo/lake-eyre-and-bulloo/hydrology.html |
Site footer

 — Department of Environment, Science and Innovation