

|
|
Queensland Murray-Darling Freshwater Biogeographic ProvinceQueensland Murray-Darling Freshwater Biogeographic Province – Climate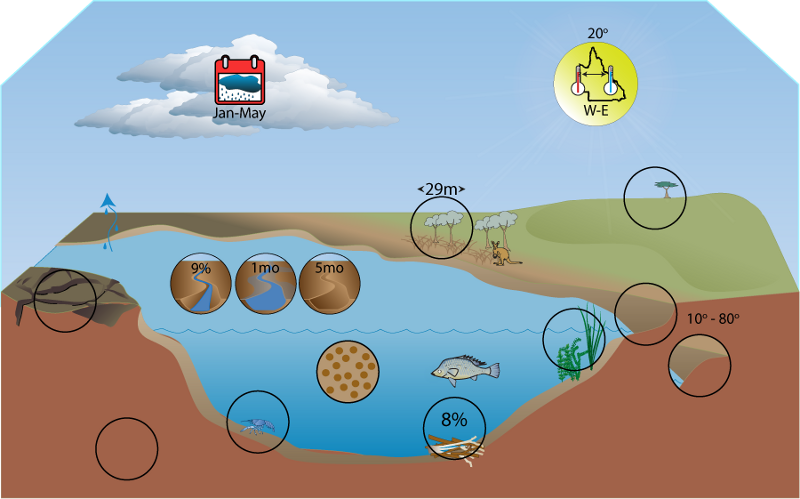 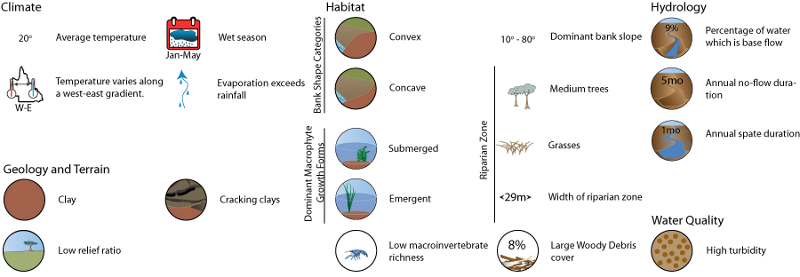 Click on elements of the model or select from the tabs below
RainfallAn obvious east to west gradient exists for annual mean precipitation, ranging from very dry to moderate. Areas located in the east of the FBP, lying in the foothills of the Great Dividing Range, receive the highest annual mean precipitation. Similarly, the driest quarter mean precipitation ranges from dry to wet along an east to west gradient. Rainfall erosivity, the potential for rainfall induced soil loss[3] is low throughout the FBP. Precipitation results in lateral run-off from the surrounding floodplains into rivers, supplying nutrients and debris (allochthonous inputs) to the system. In the Murray-Darling FBP this accounts for the majority of river flow. Low annual mean precipitation means a reduced incidence of such events. Inundation of the floodplain by overbank flows serves the same purpose, though flooding is also a result of precipitation occurring somewhere in the system. The low frequency of allochthonous inputs means that production within the channel, primarily by algae, is important. Production is also increased when the floodplain is inundated; therefore flooding events are significant for the organisms that utilise algae.
Murray-Darling FBP Rainfall Maps State Rainfall Map TemperatureThe annual mean temperature for the Murray-Darling FBP ranges from cool to cold, with the lowest temperatures recorded from the areas of the FBP at higher altitude. There is an extremely strong longitudinal gradient for the values of the highest weekly mean maximum temperature, ranging from cold to warm. The highest value for this statistic recorded in the FBP is 36.5°C. The Murray-Darling FBP is the coldest FBP in the state with the lowest value for the lowest weekly mean maximum temperature recorded for any FBP (0°C). Temperature values for this statistic range throughout the FBP from cool to cold, and it is obvious that the values are influenced by altitude: areas in the FBP at higher altitudes are cooler than those at lower altitudes. The ratio of the hottest weekly maximum to the coldest weekly minimum values was high throughout the FBP. This suggests that seasonality in temperature is pronounced, and that areas in the Murray-Darling FBP experiencing hot summers are experiencing cold winters. Sections of the FBP that experience a low hottest month mean maximum temperature support an array of cold adapted species that occur nowhere else in Queensland. Examples of these species are the river black fish (Gadopsis marmoratus) and mountain galaxias (Galaxias olidus). Both of these species are intolerant of warm water so they can only survive in streams that remain cool throughout the year. These cooler parts of the FBP may also lack species found elsewhere in the FBP that rely on warmer temperatures for some aspect of their life cycle, for example fish that rely on a rise in water temperature as a spawning cue. Diversity of temperature conditions may result in higher species richness as thermal requirements of more species may be met.
Summary Maps of FBP Temperature State Temperature Map
Water balanceAnnual mean run-off for the region is exceptionally low at 3 mm, displaying a slight north-south gradient, with greater run off in the southern regions of the FBP. While precipitation largely exceeds evaporation for most of the year[5][4], the dominance of sandy soils in the region results in high infiltration capacity, reducing the run-off associated with rainfall events[1][5][2].
More information about Climate References
Last updated: 22 March 2013 This page should be cited as: Department of Environment, Science and Innovation, Queensland (2013) Queensland Murray-Darling Freshwater Biogeographic Province – Climate, WetlandInfo website, accessed 18 March 2024. Available at: https://wetlandinfo.des.qld.gov.au/wetlands/ecology/aquatic-ecosystems-natural/riverine/freshwater-biogeo/murray-darling/climate.html |
Site footer

 — Department of Environment, Science and Innovation