

|
|
Central Freshwater Biogeographic ProvinceCentral Freshwater Biogeographic Province – Climate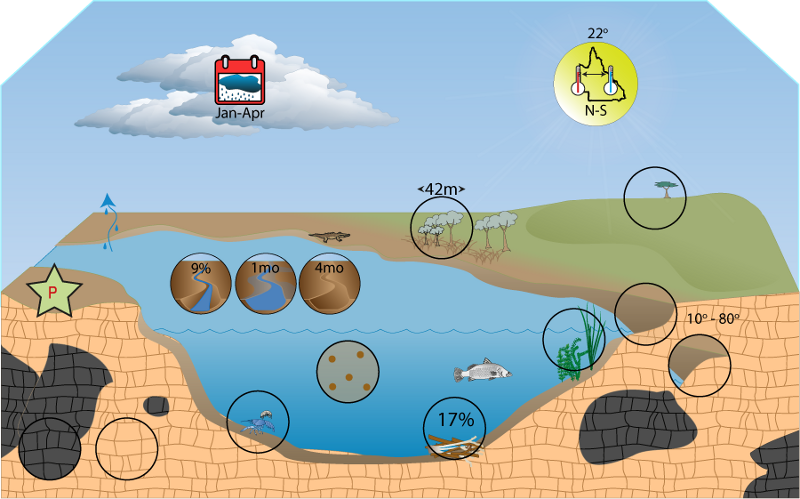 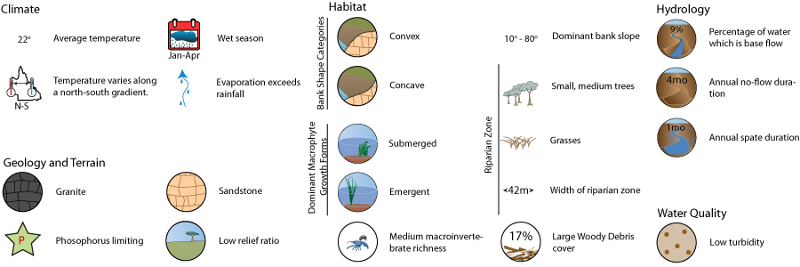 Click on elements of the model or select from the tabs below RainfallAnnual mean precipitation is largely moderate across the FBP. Areas receiving high rainfall are located along the coast. There is a north to south gradient of values for the driest quarter mean precipitation ranging from dry to wet, the lowest value being 0 mm. Rainfall erosivity, the potential for rainfall-induced soil loss[1], is low to high throughout the FBP, though it decreases with distance from the coast. Areas of the FBP that receive the highest annual mean precipitation have the highest rainfall erosivity values. The minor occurrence of valley bottom flat areas suggests floodplains and the processes associated with floodplain inundation are not as important to the ecology in this FBP as they are in the Murray-Darling. Heavy rainfall events in this FBP are unlikely to result in increased periods of productivity due to the decreased occurrence of floodplain inundation. The dominance and broad distribution of erosional areas suggests most rainfall will run off the landscape and into the instream channel.
TemperatureOn average the mean temperature for the FBP ranges from cold to moderate; there is a rough north-south gradient with hotter temperatures to the north. There also appears to be an east-west gradient related to the maximum and minimum weekly temperatures. Coastal areas consistently have lower maximum and minimum temperatures than inland areas. The ratio of the weekly maximum and minimum temperatures is greatest in the south-east corner, though it is variable throughout the FBP. Seasonality in temperature is pronounced in the south of the FBP but not in coastal areas.
Water balanceMean annual run-off in most of the FBP, particularly the inland areas, is low to negligible (0.01 mm), meaning that most rainfall is lost as evaporation. Mean annual run-off along the coast ranges from low to high.
References
Last updated: 22 March 2013 This page should be cited as: Department of Environment, Science and Innovation, Queensland (2013) Central Freshwater Biogeographic Province – Climate, WetlandInfo website, accessed 18 March 2024. Available at: https://wetlandinfo.des.qld.gov.au/wetlands/ecology/aquatic-ecosystems-natural/riverine/freshwater-biogeo/central/climate.html |

Site footer

 — Department of Environment, Science and Innovation