

|
|
Central Freshwater Biogeographic ProvinceCentral Freshwater Biogeographic Province – Hydrology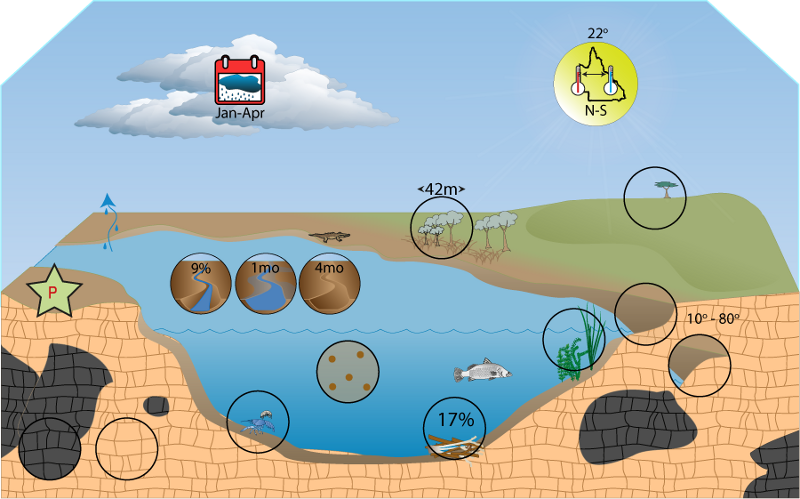  Click on elements of the model or select from the tabs below Gauges
Modelled pre-development data from 52 gauges within the Central FBP were used for these analyses. Key features of typical hydrographs over multiple temporal scales were used to characterise the following aspects.
Base flow and flood flowOn average approximately 9% of flow (by volume) is base flow and conversely 91% of flow is related directly to flood flow from rainfall events. Over 30% of flow was base flow at one site in the Pioneer catchment, while flood flow contributed 97% of total flow volume at one site in the Burdekin catchment.
Magnitude of spatesMagnitude of spates averaged 0.4 to 0.6 ML km2 day-1, but much larger and smaller average values occur within the FBP at particular sites. There is an average of 3 to 4 spates per year, with approximately two occurring during the wet season and one during the dry season. The average duration of spates is approximately 11 to 12 days. Information about magnitude of spates
No flow spells
Flow can generally be considered to be intermittent in the Central FBP. Each of the 52 modelled sites experienced periods without flow. However, some sites in the Burdekin and Pioneer catchments had natural flow regimes that were nearly perennial, with very few no flow periods in the record. Sites in the FBP on average had 3 - 4 no flow spells per year lasting on average 29 days each. The average longest recorded spell was over 8 months, but this was as high as almost 2 years at one site in the Burdekin catchment and as low as only 22 days at one site in the Pioneer catchment. Sites in the FBP had no flow on average approximately 30% of the time, but this varied from only 0.3% of the time at a site in the Pioneer catchment to nearly 90% of the time at a site in the Burdekin catchment. Periods of flow between no flow spells typically lasted approximately 10 months, both the longest (32 years) and shortest (3 months) periods with continual flow occurred in the Burdekin catchment. When averaged across the gauges the longest period of continual flow was 6.25 years for the entire FBP. Persistent waterholes are the most evident form of drought refugia in the Central FBP. Another possible source of refuge in the FBP is migration into sub-surface water in the form of shallow alluvial aquifers. There is evidence of such migration occurring in this FBP, a study found 50 invertebrate taxa in hyporheic and parafluvial shallow alluvial aquifers. Many of these were thought to be individuals of surface species that had moved into the aquifer[1]. Information about no flow spells
Rise and fall of the hydrograph
Table: Rise and Fall of the Hydrograph per day relative to mean daily flow
Wet and dry seasonsThe proportion of annual flow is not evenly distributed between months. The months January to April have a greater proportion of annual flow than if flow were evenly distributed, and the months May to December a smaller proportion. Based on this the wet season for the Central FBP is January to April and the dry season May to December. Compare this with the other FBPs.
 Dotted line shows the mean/median rainfall References
Last updated: 22 March 2013 This page should be cited as: Department of Environment, Science and Innovation, Queensland (2013) Central Freshwater Biogeographic Province – Hydrology, WetlandInfo website, accessed 18 March 2024. Available at: https://wetlandinfo.des.qld.gov.au/wetlands/ecology/aquatic-ecosystems-natural/riverine/freshwater-biogeo/central/hydrology.html |
|||||||||||||||||||||||||||||||||||||||||||||||||||||||||||||||||||||||||||||||||||||||||||||||||||||||||||||||||||||||||||||||||||||||||||||||||||||||||||||||||||||||

Site footer

 — Department of Environment, Science and Innovation